The phase transition from a superfluid to a Mott insulator in bosonic systems has been intensively investigated since it was observed in an ultra cold Bose gas trapped on an optical lattice. [1] The atomic gas was trapped in a harmonic potential and a periodic lattice potential generated by laser beams. This system can be well described by Bose-Hubbard model (BHM)

where bi (bi†) is the boson destruction (creation) operator at a site i and Z=6 is the coordination number in the cubic lattice. In the optical lattice system, the ratio of the transfer integral t and the repulsive interaction U can be controlled simply by tuning the intensity of the laser beams, which makes this system an ideal laboratory for investigating quantum many-body problems. In order to first discuss the thermodynamic properties, we neglect the gradient of the chemical potential corresponding to the trapping potential. We also choose μ/U=1/2 in order to study a typical case of the phase transition.
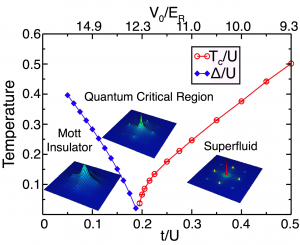
Here, we report the results of the quantum Monte Carlo (QMC) simulation of BHM using a modified directed-loop algorithm [2]. The directed-loop algorithm is one of the most widely applicable algorithms for QMC based on the Feynman path integral. The modification makes the algorithm very efficient in particular for the bosonic systems. We show the finite temperature phase diagram in Fig. 1. For large t/U at fixed temperature, the system is in the superfluid phase. When t/U is decreased and reaches a certain value, a phase transition to a normal gas phase occurs. As a function of the transfer integral, the transition temperature decreases as t/U decreases, and eventually it vanishes at the quantum critical point. Beyond this point, the system at T=0 is in the Mott insurating phase, with an excitation gap increasing with decreasing t/U.

![]()
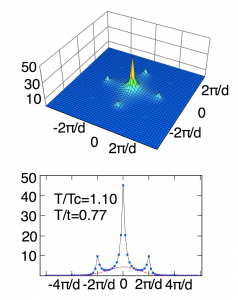
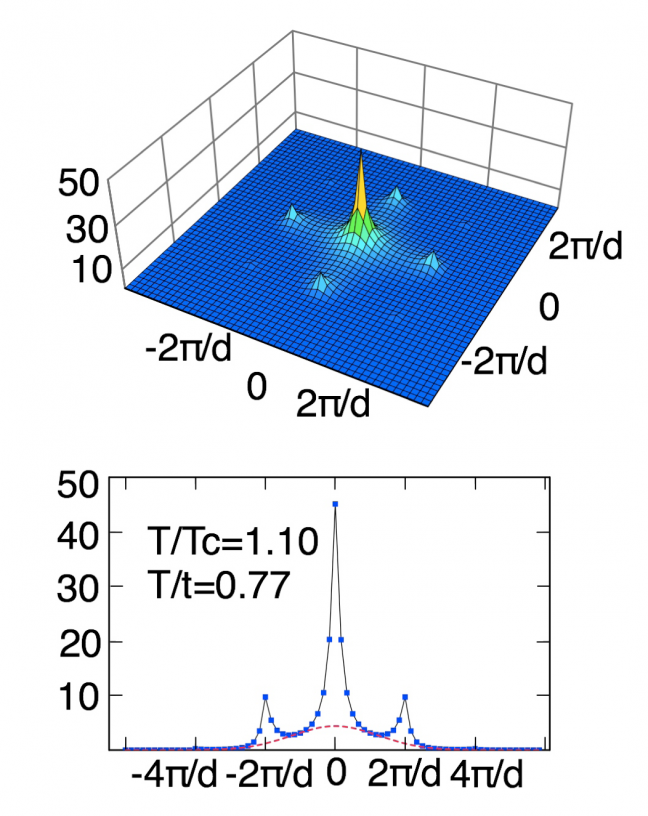
where W(k) is the Fourier transformed Wannier function and n(k)= Σi,j < bi† bj > exp{ik⋅ (ri –rj)}. In Fig. 1, three typical cases, i.e., the superfluid, Mott insulator, and critical, are shown. As is naturally expected, we see sharp peaks in the pattern in the superfluid region, while they do not appear in the Mott insulator region. The sharp peaks, therefore, have been regarded as a clear indicator of the superfluidity, and their disappearance have been thought to occur at the quantum phase transition to the Mott insulator phase. However, in Fig. 2 we see rather sharply peaked interference pattern near the critical temperature (t/U=0.25 and T=1.1Tc ) but still clearly in the normal gas phase. In this region, the superfluid density is zero. Nevertheless, the sharp peaks are present. The width of the sharp peaks in the normal region corresponds to the inverse of the correlation length. Near the critical temperature, the correlation length is large and the peaks, therefore, tends to be so sharp that it cannot be distinguished from delta-function peaks that truely signify the superfluidity. Thus, our results show that the interference pattern with sharp peaks is not necessarily a reliable indicator of superfluidity.

Reference
[1] M. Greiner, O. Mandel, T. Esslinger, T. W. Hänsch, and I. Bloch, Nature 415, 39-44 (2002).[2] Y. Kato, T. Suzuki, and N. Kawashima, Phys. Rev. E 75, 066703 (2007).
[3] Y. Kato, Q. Zhou, N. Kawashima, and N. Trivedi, Nature Physics 4, 617 (2008).
